Screen II: Performance
What is the BonusBank Performance screen? What can I find in it? How does it work? Keep reading and you will find the answer to these questions.
What is the Performance screen and what data do we find there?
The Performance screen is one of the app's four home screens, where you can see your Score and Participation Index, depending on the Tokens you are obtaining.
If you are wondering what the Score and Participation Index are, we will explain them below:
- Score. This is a number that will range from 0.0 to 5.0 and will inform any user of the average number of Tokens they are getting from all their leaders' and peers' transfers, in order to recognize a certain skill.
As specified, the score will be displayed individually for each Token, as well as an average score of the total number of Tokens linked to a category.
- Participation Index. Just as earning Tokens is very important to improve our Score, so is sending Tokens. The Participation Index measures, through an algorithm, how much and how we recognize our colleagues and leaders for their daily work.
It is a figure that ranges from 0% to 100% and has an impact on our score if it is too low or too high (negatively and positively, respectively). It is always advisable to have it over 80% for each Token, individually.
What does the Performance screen look like
To illustrate what was explained about the Performance screen and the two main variables displayed on it, we now show an example of how you can see your own Performance in the application and so we can describe in more detail its variables:
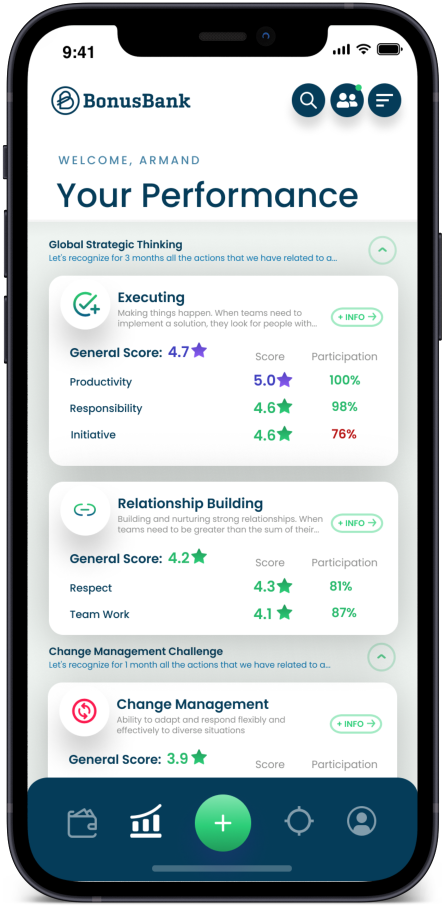
As in the Token Wallet, we have several cards, which show a Token category (with its different linked Tokens), grouped by Plan.
As you can see, there are different Token categories that are grouped by Plan; so if we have multiple Plans, the Token categories from those different Plans will not be mixed up.
Remember, there can be several Tokens per each Token category. So we can see more than one Token on the same card (where the category is shown). If you have only one Token per category, the Token score and the general score will be the same. If not, general score will show the average of all the Token scores that you have.
For each variable, as you can see in the image, there is a colour code. This makes it quicker and more intuitive for the user to know how they are progressing:
Score. It will be green, except when we reach 5.0/5.0, where it will be purple.
Participation Index. It will be shown in red whenever we are below 80%. Once we reach or exceed this figure, it will be green.
The "+info" button gives us more detail about the Token category itself (via a complete description): description, related Tokens, Token Pack it belongs to, etc.
Brilliant! We know everything about our Performance, let's go to the Targets?